
In the Dispatcher Paragon Cloud Web UI navigation menu, expand Reports, then click one of the sub-menu items: Overview, Users, or Printers. The last option, Legacy reports, is described in the Legacy reports chapter.
These reports are available only for the accounts of type Customer and Customer container.
Only users with the ViewReport right might see the Reports in the menu.
Date range
All reports include a Report period selector that allows the user to select one of the predefined date ranges: Last Week, Last Month, Last Quarter, or Last Year. You can also set a Custom date range.
Reports with a range greater than 90 days show data by month; shorter ranges show data by day.
The table below shows examples of date ranges for .
|
Date range |
From date |
To date |
Granularity |
|---|---|---|---|
|
Last Week |
(inclusive) |
(exclusive) |
Day |
|
Last Month |
(inclusive) |
(exclusive) |
Day |
|
Last Quarter |
(inclusive) |
(exclusive) |
Month |
|
Last Year |
(inclusive) |
(exclusive) |
Month |
The day boundaries respect the time zone of the given Dispatcher Paragon Cloud environment.
Export
You can export each chart to CSV, MS Excel, or download as an image by clicking … (three dots) and selecting one of the options under the Download menu.
Data accuracy
Actual paper sizes are converted to A4/Letter or A3/Tabloid sizes. Total page summaries (across all paper sizes) are calculated as A4/Letter-equivalent pages. For details, see Accounting - Impressions vs pages.
Dispatcher Paragon Cloud does not act as a print accounting solution. The reported data are calculated on a best-effort basis. See Accounting capabilities of Gen 2 Cloud Terminals for more information about the accounting capabilities of Dispatcher Paragon Cloud Gen2 Cloud terminals.
Overview
The “Overview” section consists of three main categories: Overview, Costs, Savings, and ESG Impact.
Overview
The “Overview” report provides a summary of all active users’ Prints and Copies.
Costs
The “Costs” report contains an estimate of the costs consumed. Based on costs per page, which customers can configure in Customer account settings.
Savings
The “Savings” report provides an overview of the natural resources saved, including trees, electricity, CO2 emissions, and water. Savings can be achieved by:
-
duplex print instead of simplex print
-
usage of recycled paper
-
not printing jobs submitted to the print queue
ESG Impact
The “ESG Impact” report provides an overview of the natural resources consumed, including cut trees, electricity consumption, CO2 emissions, and wasted water.
|
Value |
Description |
Reference |
|---|---|---|
|
Trees |
Number of trees cut to produce paper sheets. An average tree produces about 8,333 A4 sheets of paper. |
Data, Statistics, and Useful Numbers for Environmental Sustainability |
|
Electric energy |
Energy consumption is a combination of the energy needed to produce the A4 paper sheets + the energy needed to print the A4 page on a n multi-functional device. In total, we get ~20Wh per printed page. |
Pulp and Paper Industry Energy Bandwidth Study
|
|
Carbon dioxide |
The carbon footprint of one A4 sheet of paper is around 4.5 g of CO2. |
Comparison of methodologies for estimating the carbon footprint – case study of office paper |
|
Wasted water |
Wasted water during the paper production. Modern paper mills waste around 10 liters of water per 5g of A4 paper. |
Paper Task Force Recommendations for Purchasing and Using Environmentally Preferable Paper |
|
Recycled paper |
Using recycled paper saves around 57% CO2 compared to virgin paper. Set how much recycled paper you use in the Customer account settings under the Regional tab. |
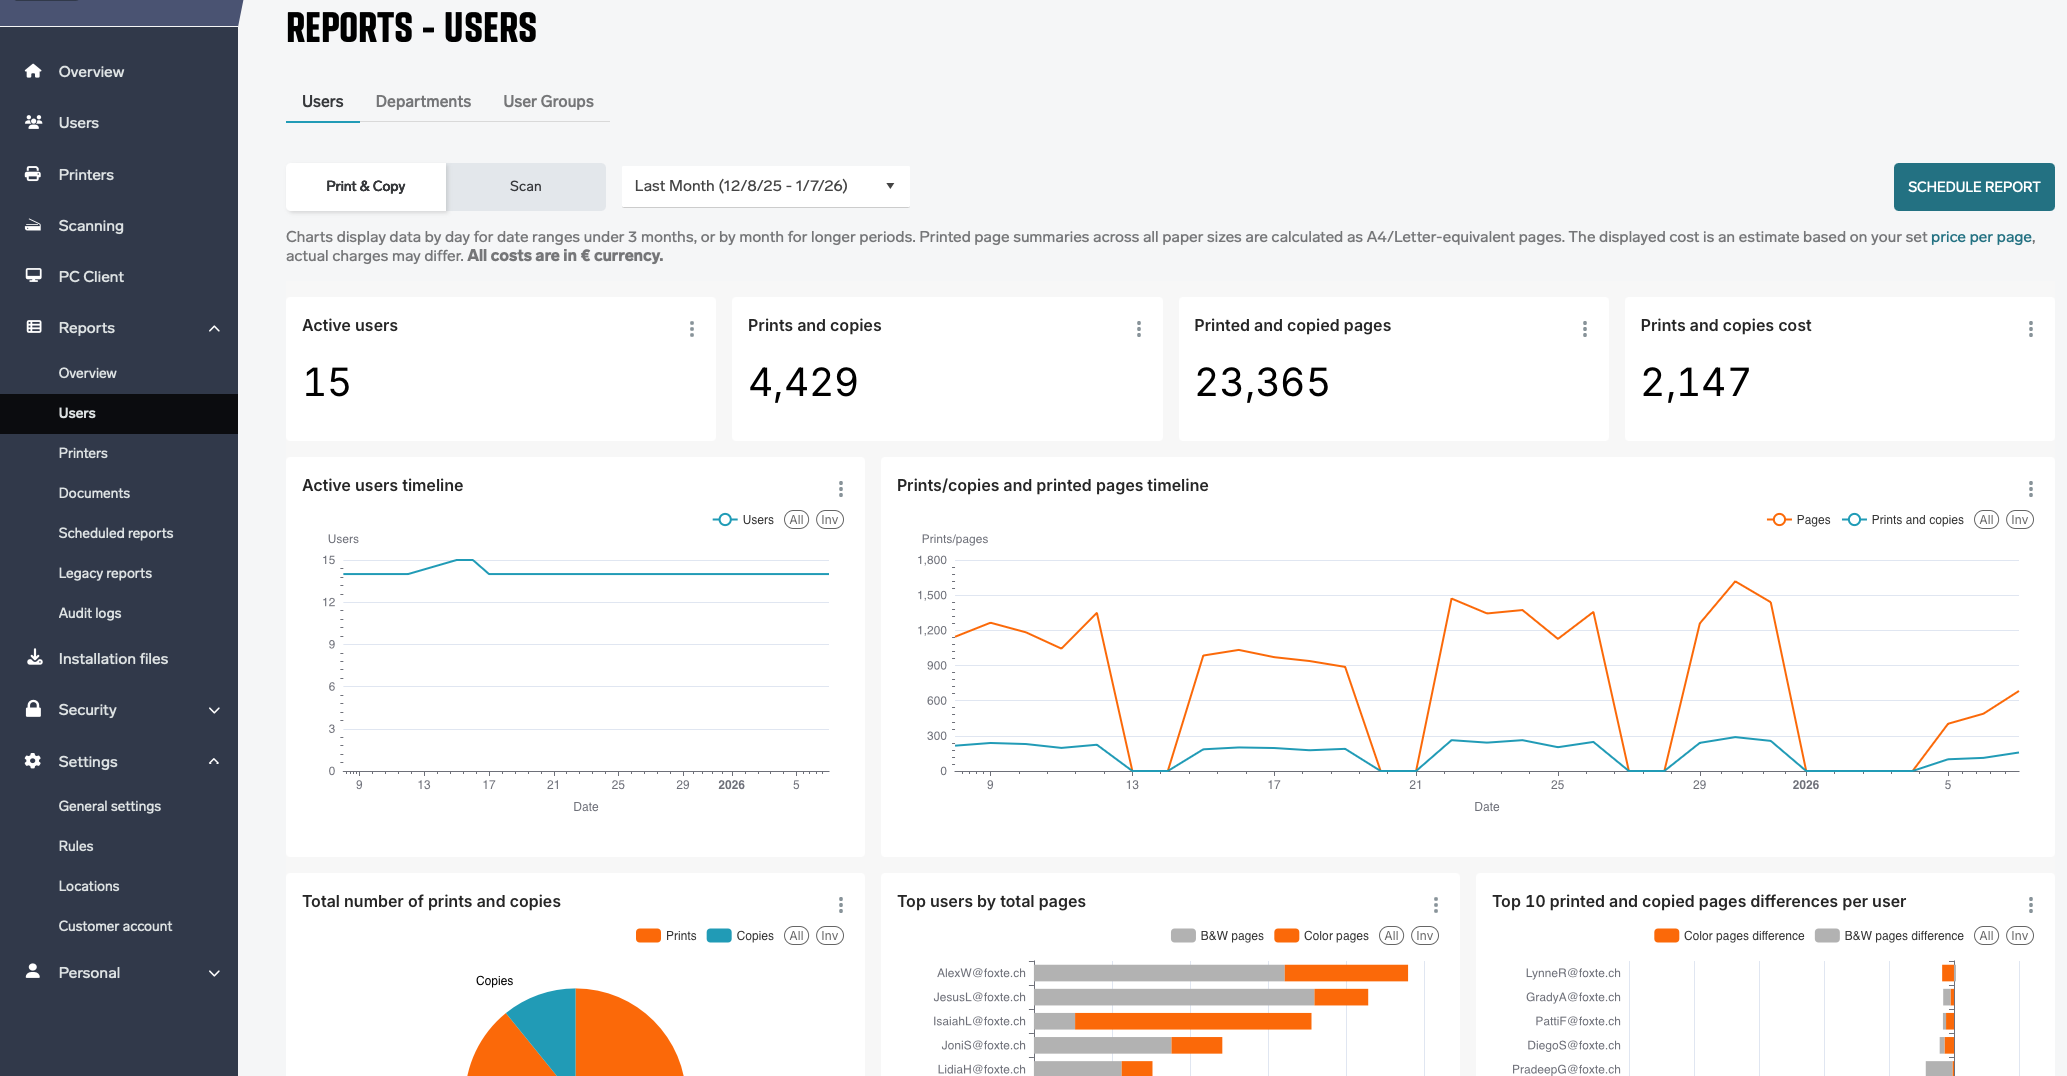
Users
The “Users” section consists of three main categories: Users, Departments, and User groups, based on the user who printed/copied the document.
Users
The “Users” report contains all details about how end users print or copy documents, aggregated to the user level.
Departments
The “Departments” report levels up the detail to the whole department.
A user can belong to only one department at once.
User groups
The “User groups” report, like department reports, aggregates the details to the entire user group, but in this case, it calculates user data for each group the user belongs to.
A user can belong to multiple user groups. It may affect the total number of prints/copies/pages for all user groups, as several groups can include the same document.
Printers
The “Printers” report consists of two main categories: Printers and Containers, based on the printer used to print or copy the document.
Printers
The “Printers” report contains all printer usage details, aggregated to the printer level.
Containers
The “Container” report aggregates the details for the entire container to which the printer belongs.
At the moment, the report will only mention the leaf container from the tree structure.